Introduction

We have covered the concepts of relational databases in "Introduction to Databases," how to access such databases in "Accessing Databases with SQL," creation of web pages with forms in "Creating Web Pages" and "Web Forms for Database Queries," and CGI programming to interface between web pages and databases and to process data in "CGI Programs and Web Forms" and "CGI Programs in C++ Using the MySQL C API," "In Genomic Data," "Genomic Sequence Comparison," and "Searching Genomic Databases," we studied some of the algorithms to process genomic data and how to use these algorithms in conjunction with the above tasks. Until now, however, we have employed existing databases. The current module, "Relational Database Development," and "Creating and Changing Databases with SQL" discuss how we can design and produce databases. The ability to do so is important for development of databases for our own use or for larger computational science applications. Throughout this discussion, we consider the "College Physics Example" of the module "Computational Science and Web-Accessed Databases" as well as other applications.


Three-Level Architecture

We can consider the database on three levels of abstraction: external, conceptual, and internal. (See Figure 1.)

The external level has the users' views of the database. Depending on their needs, different users access different parts of the database. For example, a doctor performing drug tests should be able to access the patients' medical data but not their hospital bills. However, a billing clerk should have a very different view of the database.

The conceptual level describes the logical structure of an entire database, including descriptions of the data and relationships among the data. For example, at this level we would describe a row of the table StudyA05 as containing the values for SSN and placebo. However, we would not give the details of the physical storage of the fields and records.

The internal level gives the details of the physical storage of the database on the computer. This level contains such details as the number of bytes for each data item, ordering of records, and data compression techniques. For example, at this level we would describe the attribute SSN as 10 bytes to store the nine-digit social security number. 

Definition The external level of a database has the users' views of the database. The conceptual level describes the logical structure of the entire database, including descriptions of the data and relationships among the data. The internal level gives the details of the physical storage of the database on the computer.


Figure 1.  Three-Level Architecture
External Level
Doctor's View Billing Office View

SSN

dosage

SSN

LastName

FirstName

 
Conceptual Level

SSN

Dosage

LastName

FirstName

Internal Level
struct {
    string SSN;
    double dosage;
    string LastName;
    string FirstName;
    ...
    }


ER Model for Conceptual Design

In 1976, Chen developed the Entity-Relationship (ER) model, a high-level data model that is useful in developing a conceptual design for a database. Creation of an ER diagram, which is one of the first steps in designing a database, helps the designer(s) to understand and to specify the desired components of the database and the relationships among those components. An ER model is a diagram containing entities or "items", relationships among them, and attributes of the entities and the relationships.

Definition The Entity-Relationship (ER) model, a high-level data model that is useful in developing a conceptual design for a database.

To make the description of the model more complete, we consider the example of a physics department at a college that maintains a database of experimental results. Throughout a laboratory, students collaborate and share their results and access data sets from other semesters on a computer system. For example, in the laboratory session on "Freely Falling Objects with Significant Drag," students determine the drag coefficient by dropping dust balls from different heights and measuring the times they take to fall. Each team enters its results into the distributed database, and the class analyzes the data. After a team enters data into the web-accessed database, all students can obtain the measurements simultaneously. To simplify the analysis, we assume that the database only stores results related to this experiment over a period of several years.


Entity

An entity is a real-world item or concept that exists on its own. In our example, a particular student (such as, "Emanuel Vagas"), team, lab section, or experiment is an entity. The set of all possible values for an entity, such as all possible students, is the entity type. In an ER model, we diagram an entity type as a rectangle containing the type name, such as student (see Figure 2).

Definition An entity is a real-world item or concept that exists on its own. The set of all possible values for an entity is the entity type.

Figure 2.  ER diagram notation for entity student


Attribute

Each entity has attributes, or particular properties that describe the entity. For example, student Emanuel Vagas has properties of his own Student Identification number, name, and grade. A particular value of an attribute, such as 93 for the grade, is a value of the attribute. Most of the data in a database consists of values of attributes. The set of all possible values of an attribute, such as integers from 0 to 100 for a grade, is the attribute domain. In an ER model, an attribute name appears in an oval that has a line to the corresponding entity box, such as in Figure 3
Definition An attribute of an entity is a particular property that describes the entity. The set of all possible values of an attribute is the attribute domain.


Figure 3.  ER diagram notation for an attribute domain (StudentGrade) of an entity type (student)


Quick Review Questions
Quick Review Question 1  Give the ER diagram notation for an entity type team with attributes TeamNumber and TeamGrade.

Sometimes the value of an attribute is unknown or missing, and sometimes a value is not applicable. In such cases, the attribute can have the special value of null. For example, until the professor grades a laboratory assignment, the team grade is missing or null. For a student who is auditing a course but participating as a team member, it is not applicable for that student to have an individual grade; the student's grade can have the value of  null.
Definition Null is the special attribute value that indicates an unknown or missing value.

An attribute can be simple or composite. A simple attribute, such as grade, is one component that is atomic. If we consider the name in two parts, last name and first name, then the name attribute is a composite. A composite attribute, such as "Emanuel Vagas", has multiple components, such as "Emanuel" and "Vagas"; and each component is atomic or composite. We illustrate this composite nature in the ER model by branching off the component attributes, such as in Figure 4.
Definition A simple attribute is one component that is atomic. A composite attribute has multiple components, each of which is atomic or composite.

Figure 4.  ER diagram notation for composite attribute domain, name


Another way to classify attributes is either as single-valued or multi-valued. For an entity an attribute, such as StudentGrade, usually holds exactly one value, such as 93, and thus is a single-valued attribute. However, two lab assistants might assist in a laboratory section. Consequently, the LabAssistant attribute for the entity LabSection is multi-valued. A multi-valued attribute has more than one value for a particular entity. We illustrate this situation with a double oval around the lab assistant type, LabAssistant (see Figure 5).

Definition For a particular entity, an entity attribute that holds exactly one value is a single-valued attribute. A multi-valued attribute has more than one value for a particular entity.

Figure 5.  ER diagram notation for multi-valued attribute domain, LabAssistant


A derived attribute can be obtained from other attributes or related entities. For example, the radius of a sphere can be determined from the circumference. We request the derived attribute with a dotted oval and line, such as in Figure 6

Figure 6.  ER diagram notation for derived attribute, radius

An attribute or set of attributes that uniquely identifies a particular entity is a key. For example, Emanuel Vagas' Student Identification Number uniquely identifies him. However, to determine the class we need a composite key that consists of several attributes, such as catalogue number, section, semester, and year. In the ER diagram of Figure 7, we underline the composite key, class. (The figure shows another attribute (DragExpWeek) of LabSection that stores the week of the semester (1-15) in which the drag experiment occurs.)

Definition An attribute or set of attributes that uniquely identifies a particular entity is a key. A composite key is a key that is a composite of several attributes.

Figure 7.  ER diagram notation for key StudentId for student and composite key (class, consistent of (CatalogNumber, section, year,  and semester) for LabSection


Relationship

A relationship type is a set of associations among entity types. For example, the student entity type is related to the team entity type because each student is a member of a team. In this case, a relationship or relationship instance is an ordered pair of a specific student and the student's particular physics team, such as (Emanuel Vagas, Phys201F2005A04), where Phys201F2005A04 is Emanuel's team number. Figure 8 illustrates three relationships. Unfortunately, Itnatios Trekas had to drop the course and retake it another semester. Consequently, his name is associated with two team numbers.

Figure 8. Relationships (Emanuel Vagas, Phys201F2005A04), (Ignatios Trekas, Phys201F2005A04), and (Ignatios Trekas, Phys201S2006B03)

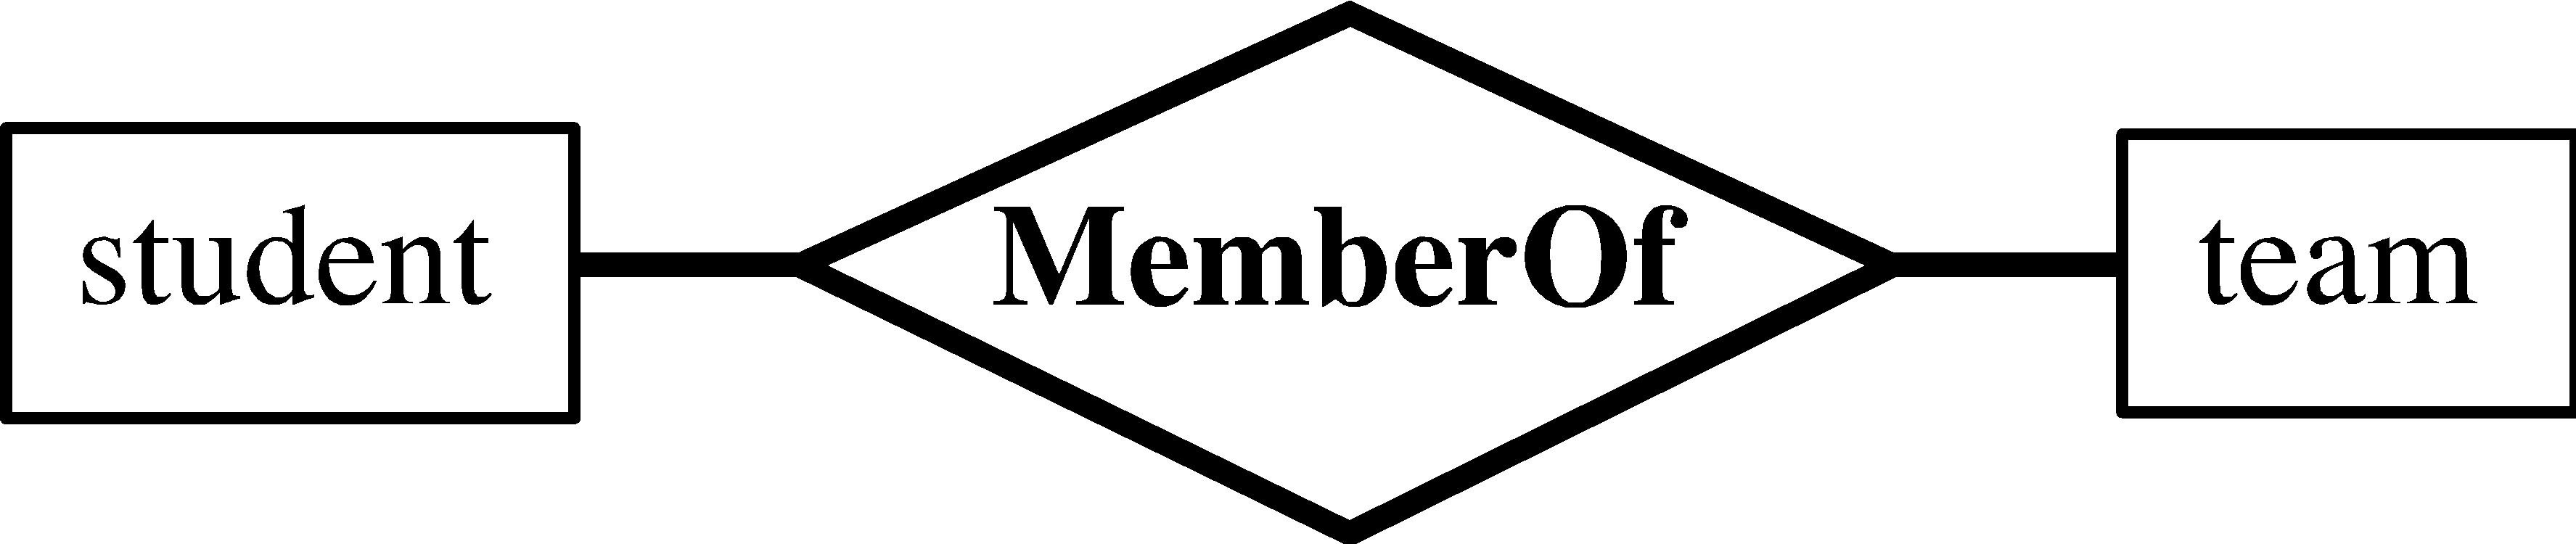
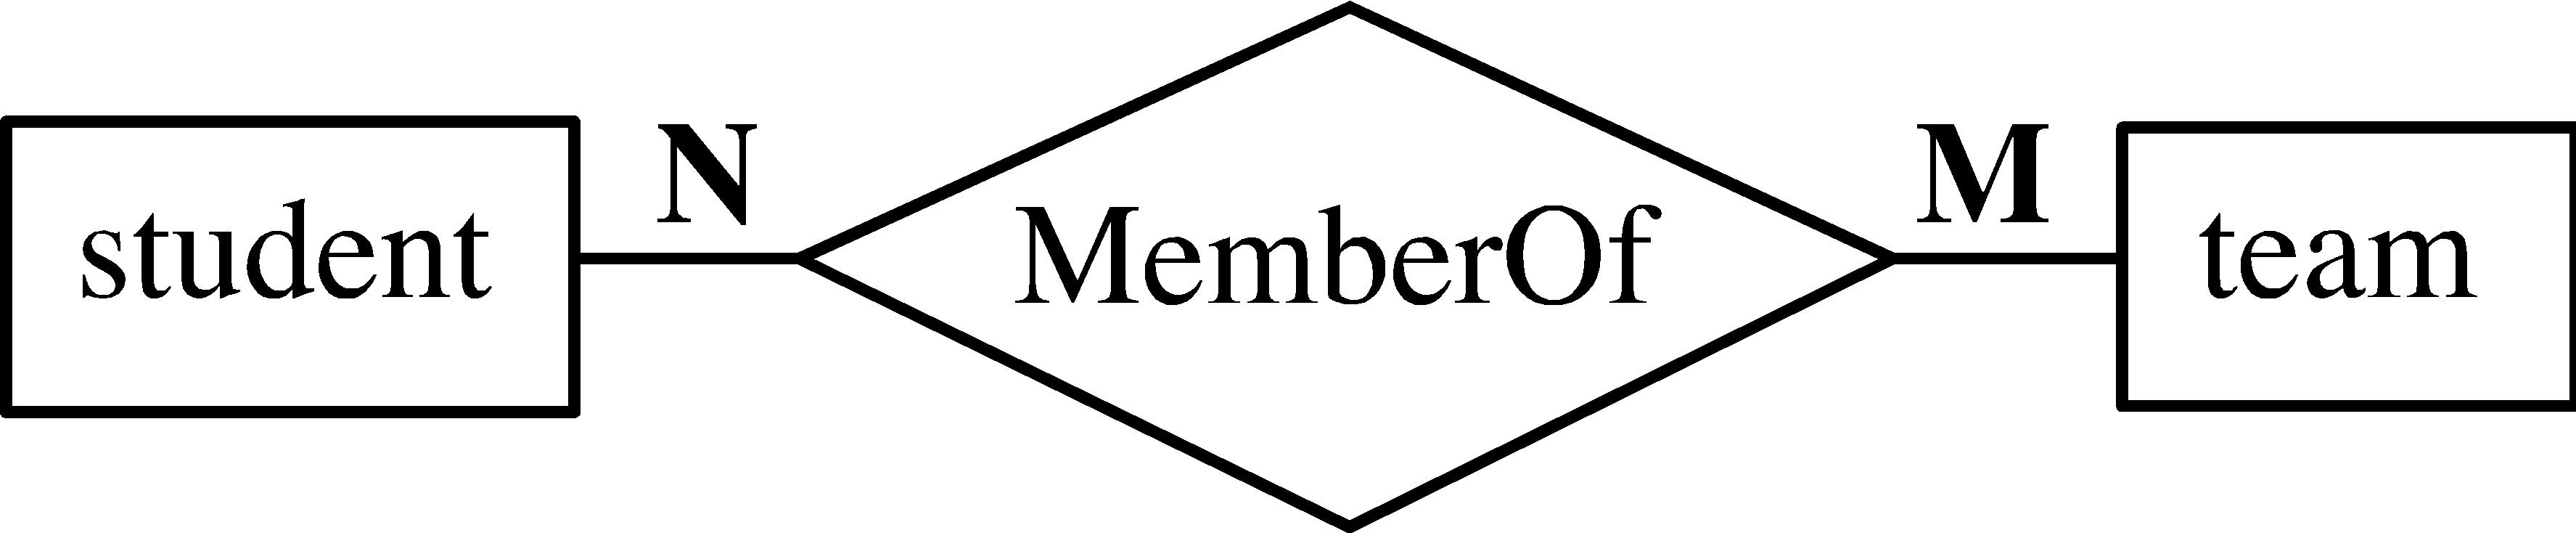
We use a diamond to illustrate the relationship type in an ER diagram, such as in Figure 9.  We arrange the diagram so that the relationship reads from left to right, "a student is a member of a team." Alternatively, we can arrange the components from top to bottom.

Definition A relationship type is a set of associations among entity types. A relationship or relationship instance is an ordered pair consisting of particular related entities.

Figure 9.  ER diagram notation for relationship type, MemberOf
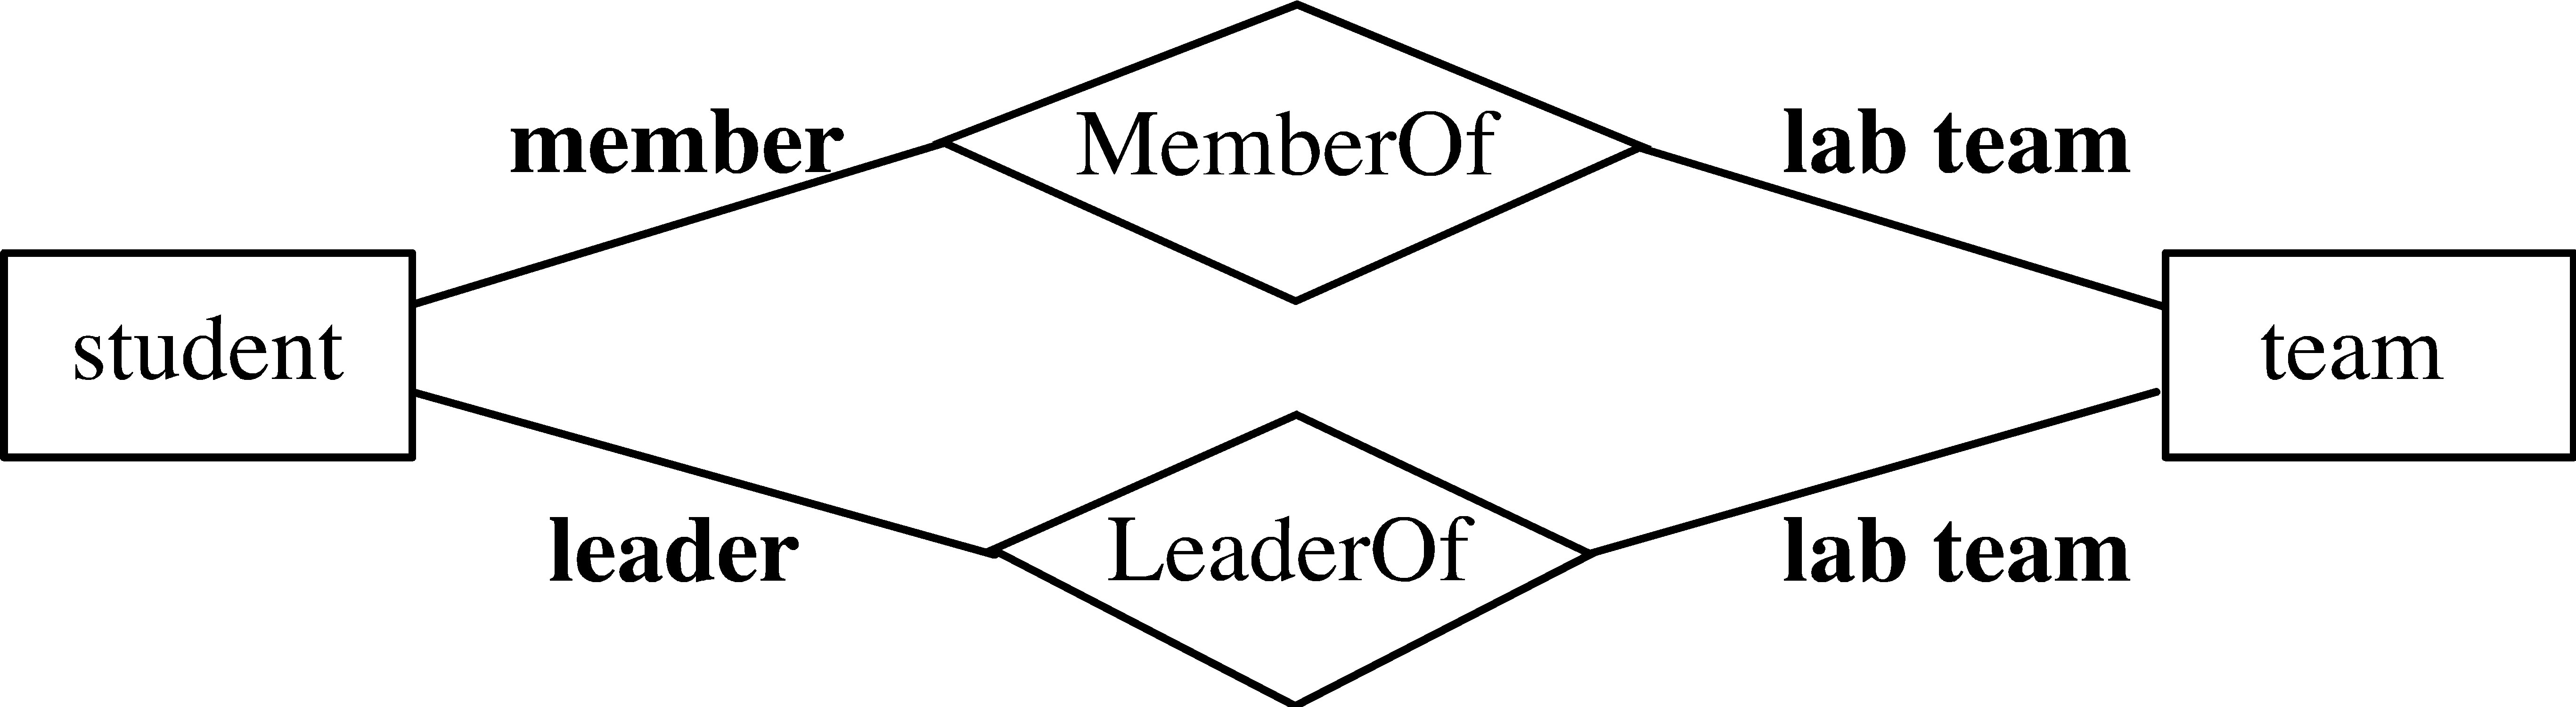
Quick Review Questions
Quick Review Question 2  Give the ER diagram notation for relationship type runs, where each team conducts a drag experiment run (DragExpRun).

The degree of a relationship type is the number of entity types that participate. Thus, the LabSecMemberOf relationship type of Figure 9 has degree 2, which we call a binary relationship type. To clarify the role that an entity plays in each relationship instance, we can label a connecting edge with a role name that indicates the purpose of an entity in a relationship. For example, we can have two binary relationship types associating the student and team types, TeamMemberOf and LeaderOf. In the former case, a student entity is a member of a team entity; in the later case, a student can be a leader of a team. We illustrate the situation in Figure 10.
Definition The degree of a relationship type is the number of entity types that participate. If two entity types participate, the relationship type is binary. A role name indicates the purpose of an entity in a relationship.

Figure 10.  ER diagram notation with roles member, leader, and lab team

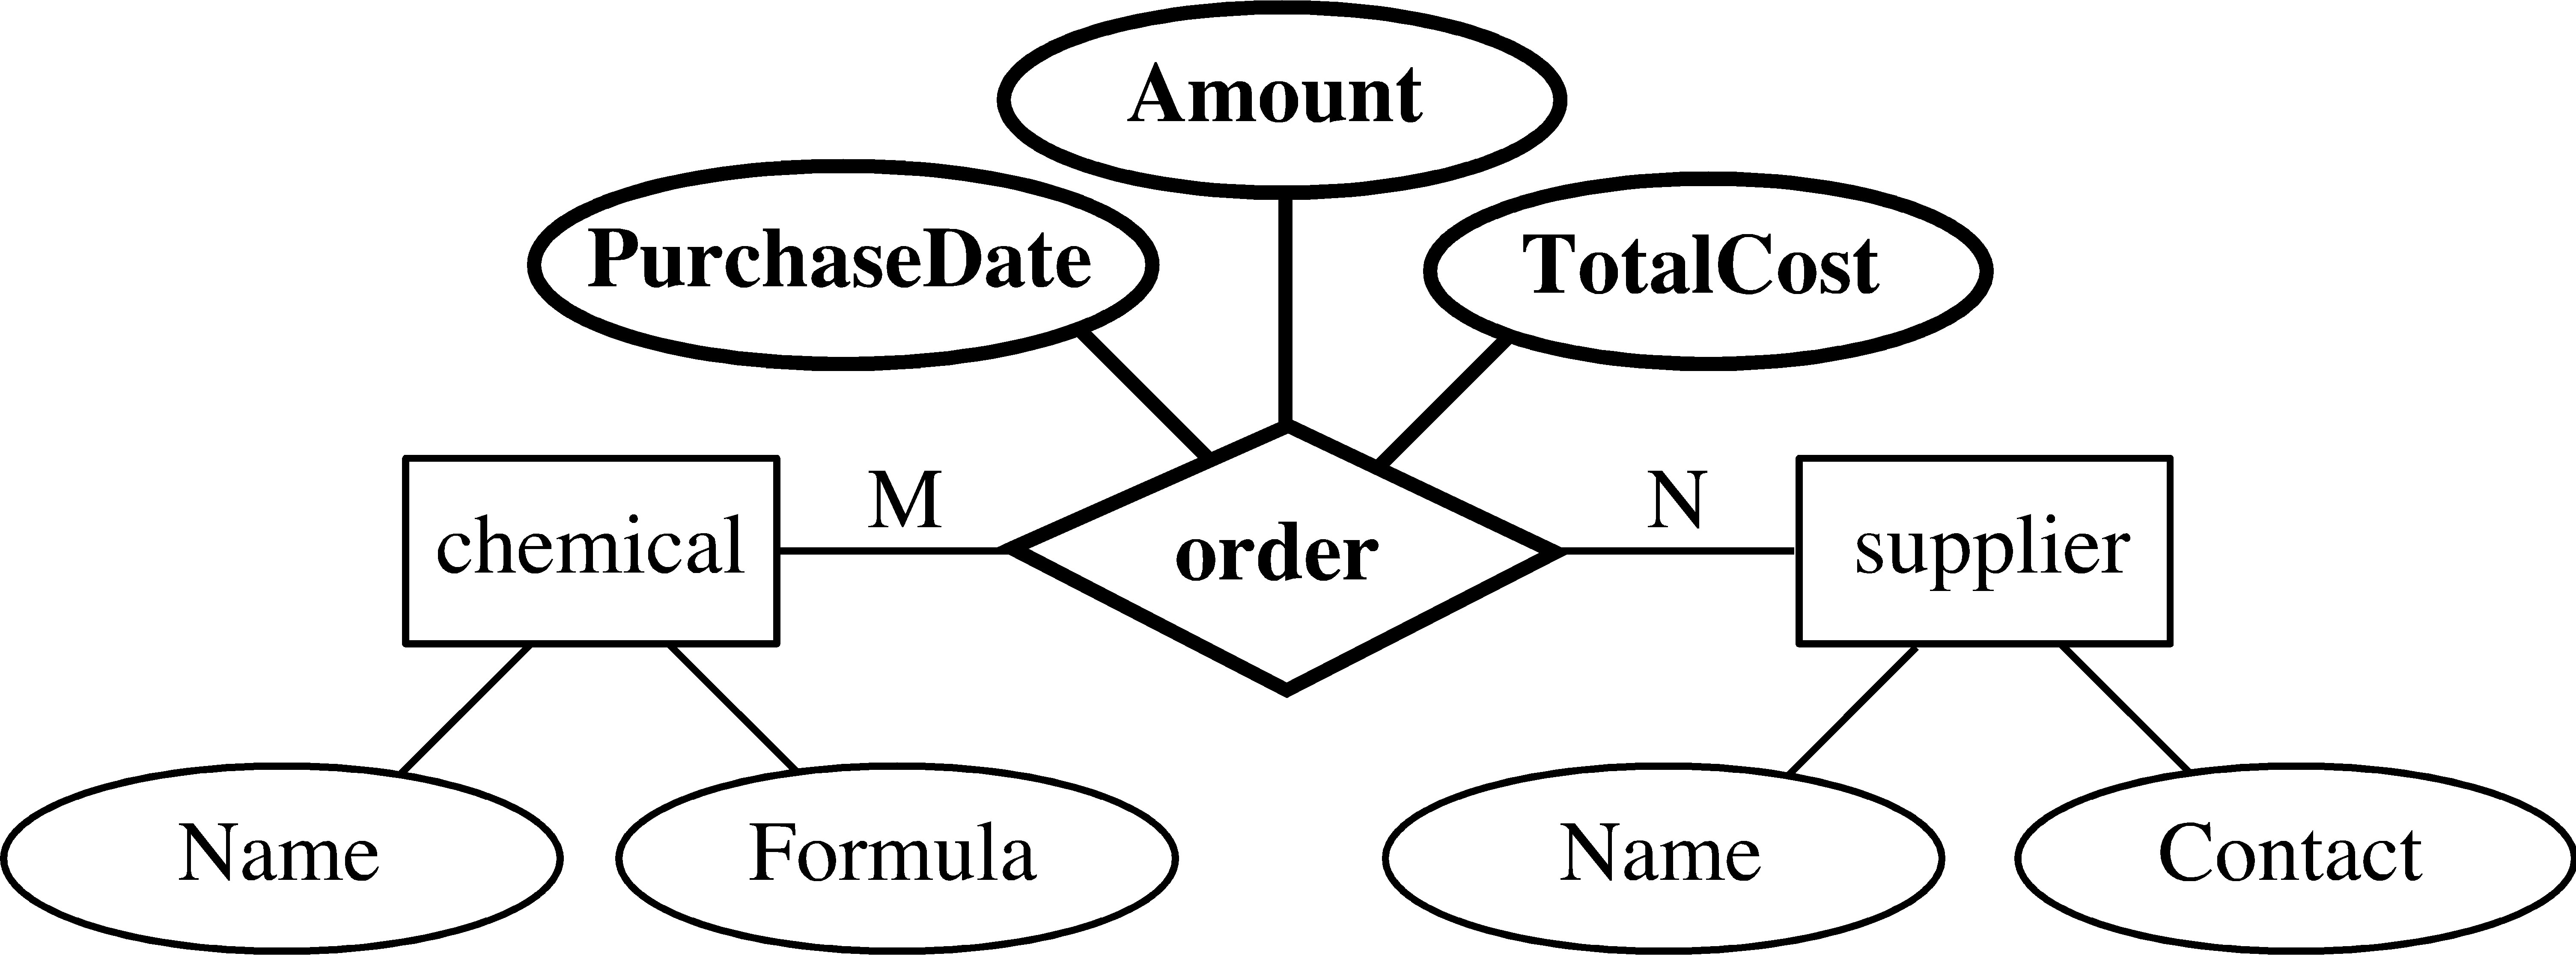
As Figure 11 illustrates, a relationship type can also have attributes. The relationship type order connects entities chemical and supplier. The relationship is many-to-many because each chemical can be from several suppliers and each supplier has a number of chemicals. An order has a purchase date, amount, and total cost as well as the chemical and supplier information. Thus, order has attributes PurchaseDate, amount, and TotalCost that we cannot appropriately associate with chemical or supplier.

Figure 11. Relationship type with attributes


Recursive Relationship

Another situation involving roles that can arise in an application is a recursive relationship. Suppose one team is assigned the task of supervising the other teams. This supervisor team makes sure that each team records its portion of the data. The supervision relationship is a recursive relationship because the same entity, a particular team, participates more than once in the relationship, as a supervisor and as a supervisee. To draw the situation, we label the two lines between team and supervision with the two possible roles (see Figure 12).
Definition A recursive relationship is one in which the same entity participates more than once in the relationship.

Figure 12.  ER diagram notation for recursive relationship type, supervision
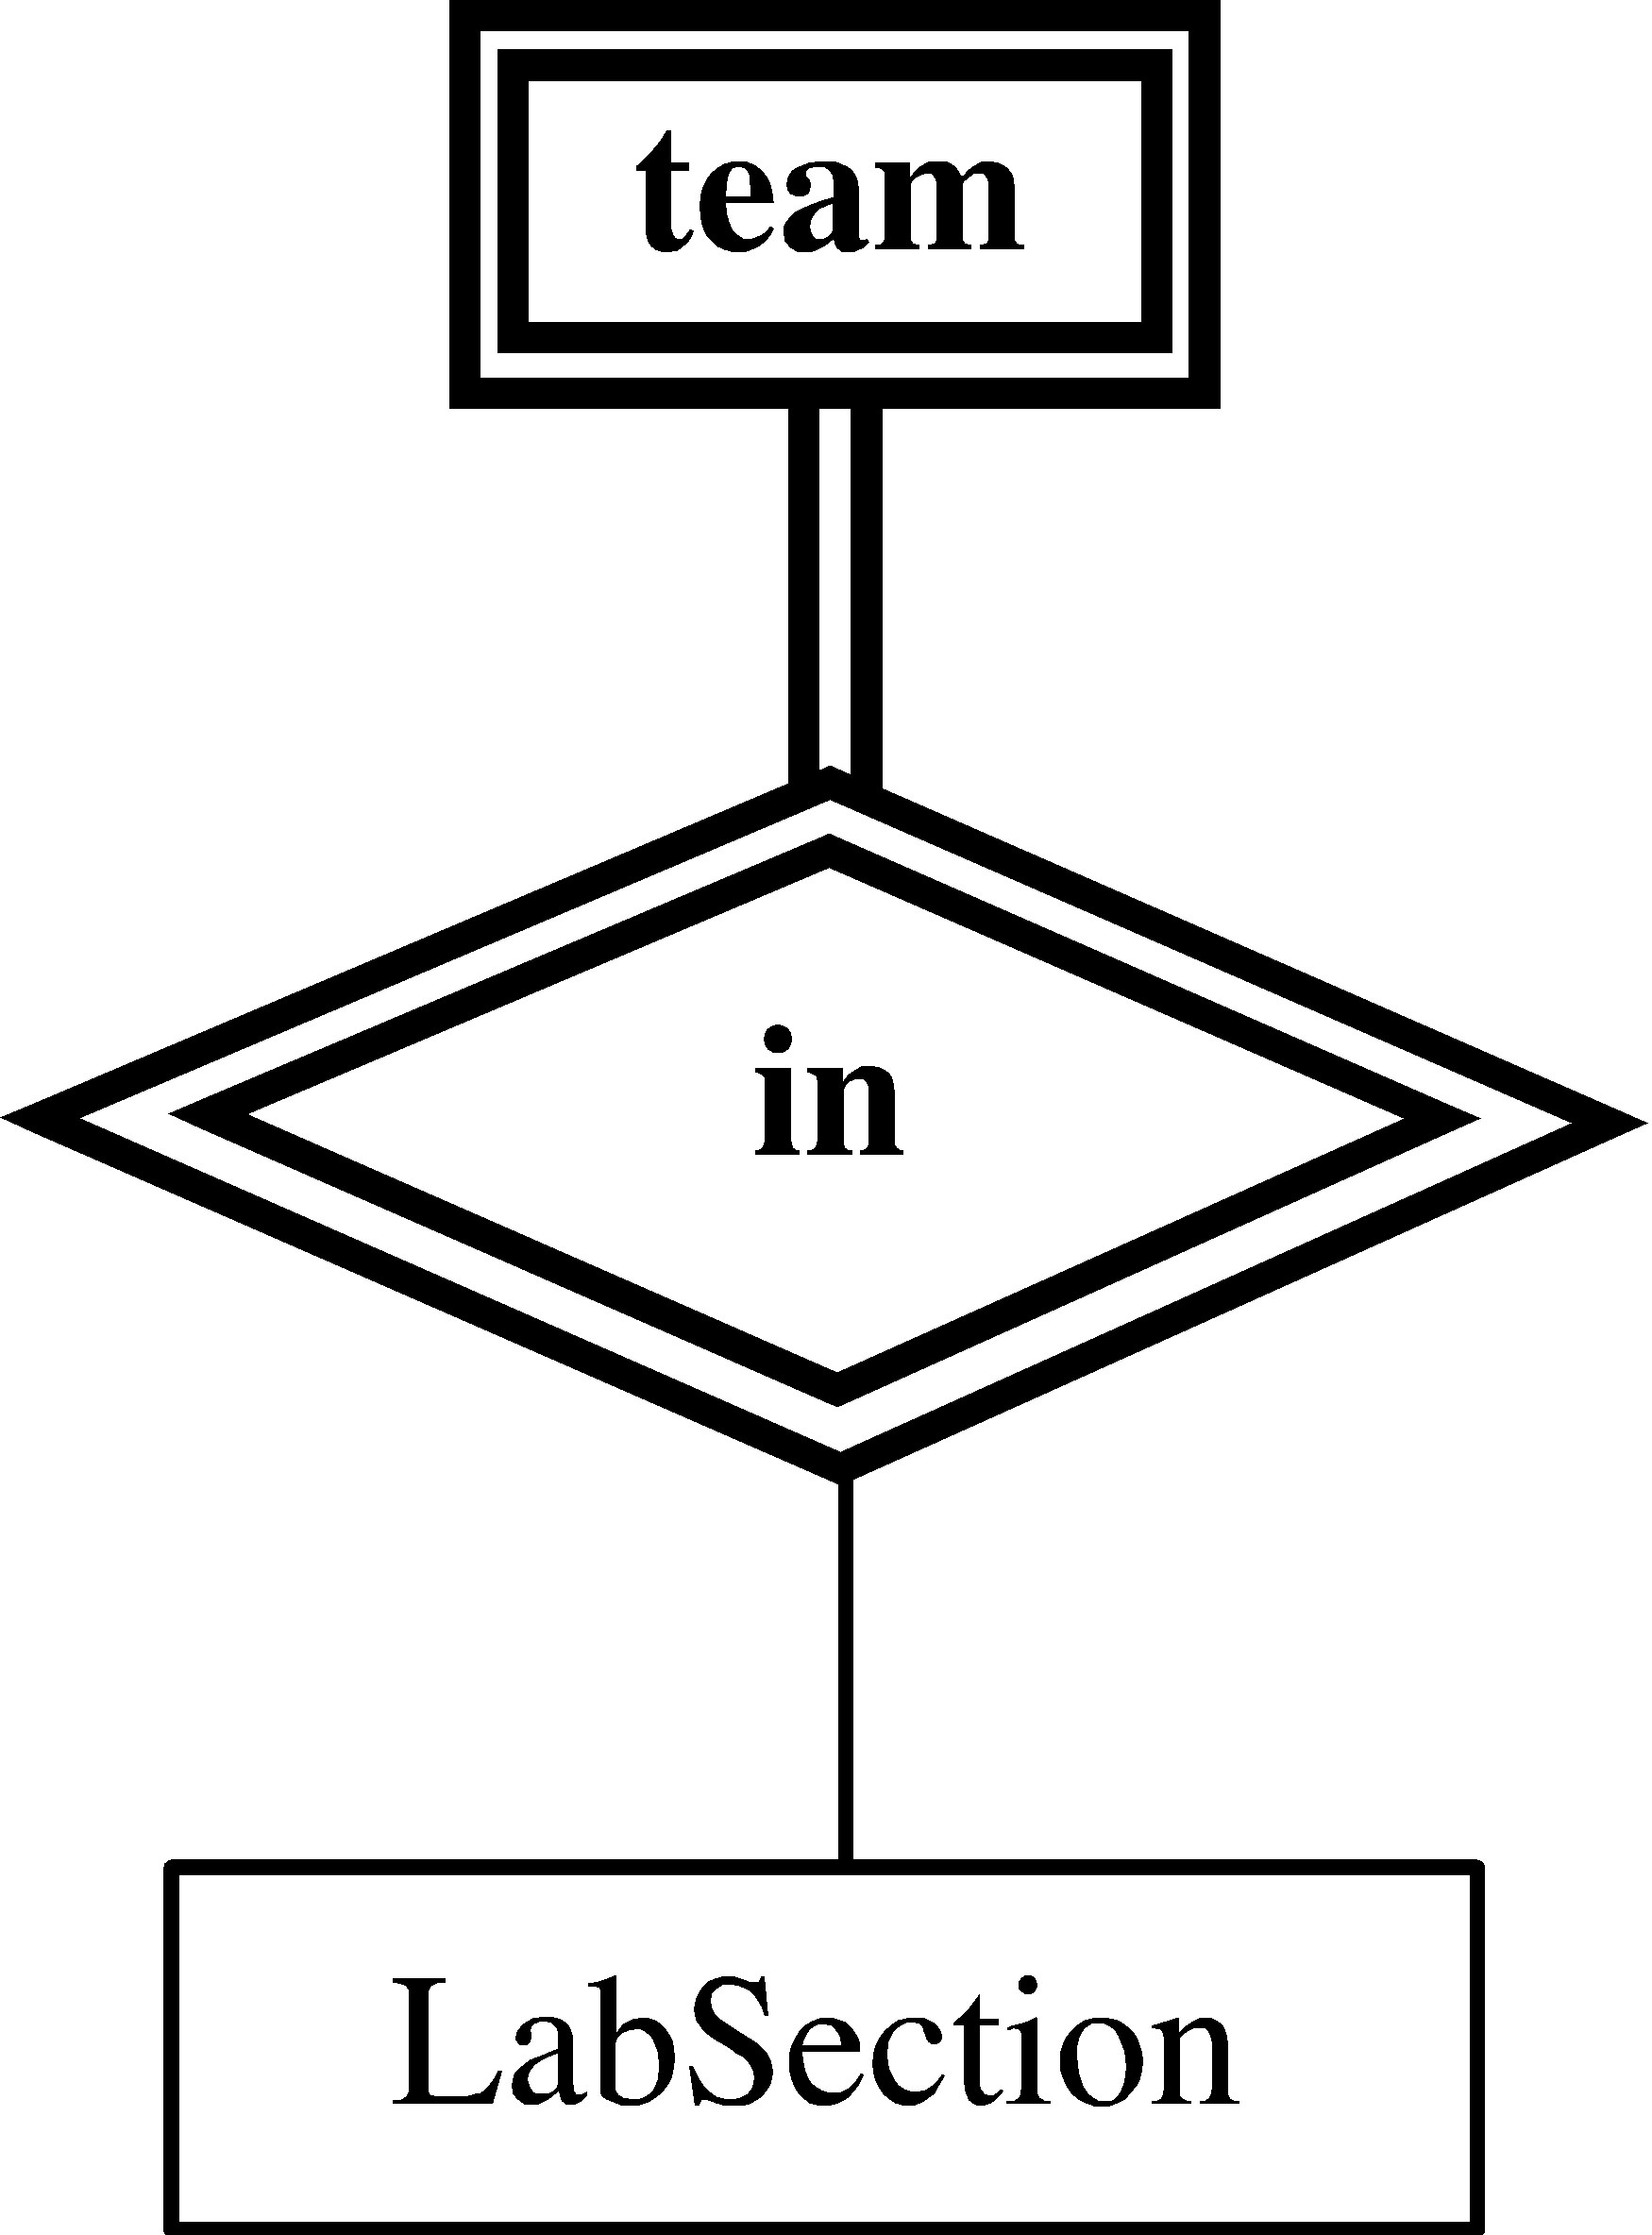

Weak and Strong Entity Types

In the physics laboratory ER model example, the entity type student is strong because its existence does not depend on some other entity type. However, the team entity type is weak. The existence of team depends on the existence of LabSection, and we call the in identifying relationship. As (see Figure 13) illustrates, we draw double lines around the identifying relationship, the team entity type, and the line connecting the two to indicate the weak entity type.

Definition An entity type is strong if its existence does not depend on some other entity type. Otherwise, the entity type is weak.

Figure 13.  ER diagram notation for weak entity type, team, and identifying relationship, in


Cardinality Constraints

If each team can have at most one student leader and a student can be a leader of at most one team, we have a 1:1 or one-to-one relationship. We can illustrate this ratio by writing ones on the lines indicating the relationship, as in Figure 14. Several teams can be in each lab section, students as members, so we write the cardinality ratio as N:1 in this many-to-one relationship and draw the diagram, as in Figure 15. Similarly, we can have a one-to-many relationship.

Figure 14.  ER diagram notation for one-to-one relationship

Figure 15.  ER diagram notation for many-to-one relationship


Because a student can retake a course, a student could be a member of more than one team. Thus, we would need different variables, say N and M, for the numbers of student and team entities, respectively; and the ratio would be N:M in this many-to-many relationship. As Figure 16 diagrams, a team has any number of students, and a student can participate in several teams during his or her college career. Ratios, such as 1:1, 1:N, N:1, and N:M, give a cardinality constraint or numeric restriction on the possible relationships.

Definition A 1:1 or one-to-one relationship from entity type S to entity type T is one in which an entity from S is related to at most one entity from T and vice versa. An N:1 or many-to-one relationship from entity type S to entity type T is one in which an entity from T can be related to two or more entities from S. A 1:N or one-to-many relationship from entity type S to entity type T is one in which an entity from S can be related to two or more entities from T. An N:M or many-to-one relationship from entity type S to entity type T is one in which an entity from S can be related to two or more entities from T, and an entity from T can be related to two or more entities from S. A ratio, such as 1:1, 1:N, N:1, and N:M, gives a cardinality constraint or numeric restriction on the possible relationships.

Figure 16.  ER diagram notation for many-to-many relationship


Quick Review Questions
Quick Review Question 3  Give the cardinality constraint on the relationship runs, where each team may have many drag experiment runs:

1:1          1:N          N:M          None


Participation Constraints 

Every student must be a member of a team, or, in other words, a student entity is of interest only if it participates in a MemberOf relationship. Thus, we can include in an ER diagram a participation constraint in which participation of student in MemberOf is total. A double line indicates the total participation constraint in an ER model (see Figure 17). However, the participation of student in LeaderOf in Figure 10 is partial, because a student might be a team leader. 

Figure 17. ER diagram notation for total participation constraint

Using the above components, we have the ER model in Figure 18

Figure 18.  ER diagram notation for total participation constraint

Table 1.  Summary of the ER diagram notation

Notation Meaning
Entity type
Attribute
Key attribute
Derived attribute
Multivalued attribute
Composite attribute
Relationship type
Total participation
Many-to-one relationship
  Weak entity type with identifying relationship


Projects

For each of the projects, do the following:
a. Draw an ER diagram. Make sure each entity type has at least one key attribute.  Document any assumptions you make.  Avoid diagrams with a single entity.
b. For each attribute, determine its domain of values, whether null is an acceptable value, and, if acceptable, what null indicates.
c. If you think the description is incomplete, list other data the database should store.
d. Adjust your design to incorporate these additions.
1. A chemistry department wants to have a database of all chemicals in the stockroom. The information includes the name, molecular formula, amount on hand, date purchased, supplier, and supplier contact information.

2. A space agency wants to develop a database of all satellites that humans have launched into space. Data includes the satellite identification, date of launch, destruction date, purpose, maximum orbital altitude, launching location, launching agency, and contact information for agency.

3. An environmental agency wants to catalogue all the plants in an area that is susceptible to acid rain. Data should include genus, species, quantity, date, quadrant identification number, quadrant location, average altitude of quadrant, and botanist.

4. A psychological study requires participants to answer a number of questions related to personality. The database should store the multiple choice answers (A, B, C, D) to the questions and information about each participant, such as participant id, age, and sex. The database should compute a score based on the individual's answers. The score indicates one of 8 personality categories. Each category has an identifying name and specifies that each of three qualities is either true or false.

Copyright � 2002, Dr. Angela B. Shiflet
All rights reserved